


Fossil fuel companies operate facilities, such as this refinery in Richmond, California, that emit greenhouse gases and affect residents' health. Photo: Jose Camones Silva
Climate-Smart Investing
Many state and local governments are considering how climate-related policies and the impacts of climate change are affecting global markets and the value of fossil fuel companies. Public sector investors are also looking at the significance of investing in fossil fuels, as we ask what vision for the future we are supporting with our dollars.
Alameda County has developed a software tool that provides insights that were not freely available to government pension funds in the past. This information can help investors make informed decisions to reduce financial risk and support sustainability goals.
Risks of Fossil Fuel Investments
As counties transition to low-carbon and renewable energy sources, the value of fossil fuel reserves diminish. The potential for stranded carbon assets poses financial risk to investment portfolios that hold fossil fuel companies, as discussed by the G20's Task Force on Climate-Related Financial Disclosures.
Increasingly frequent severe weather events can also lead to damage to assets and business disruption.
Fossil Fuel Equity Tool
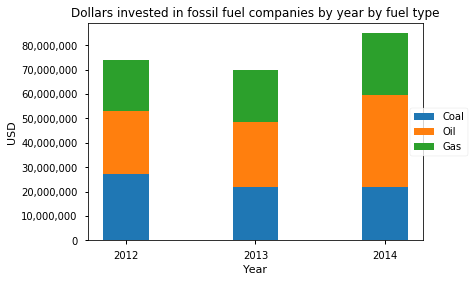
Example of graph created by the Fossil Fuel Equity Tool using sample data
This new open-source software tool can analyze any set of stock holdings to reveal the percentage of stocks in the largest coal, oil, and gas companies. (Note that the tool does not analyze holdings within mutual funds, as other tools assist with this.)
A new free tool that may be of interest is the Paris Agreement Capital Transition Assessment climate scenario tool.
What Does the Tool Do?
The tool enables institutional investors to quickly identify the amount of individual equity holdings invested in the largest publicly traded domestic and international coal, oil, and natural gas companies.
What could potentially take days to do by hand can now be done within a matter of hours with no prior knowledge of coding.
As shown in the preview, the tool provides numerical and visual data including:
- The percentage of individual equity that fossil fuels comprise in a portfolio
- Charts depicting the dollar amount invested in fossil fuel companies by year and by fuel type
- The quantity of greenhouse gas emissions contained in coil, oil, and gas reserves owned if they were burned
- Graphs showing the total carbon reserves held through investments by year and by fuel type
Getting Started With the Tool
- Request the Data
You'll want to request the key data several weeks before you plan to run the tool. These tips will save you time preparing your requests for data on the stock holdings and associated carbon reserves.
- Download the Tool
Instructions for downloading the tool and linking it to Anaconda can be found here.
- Obtain the Software
To run the tool, you will need to download free software called Anaconda. Full instructions to install Anaconda and open the tool are found here.
- Use the Tool
Once you have the tool open in Jupyter Notebook (see instructions above), it will walk you through the process of formatting the data, obtaining market cap data for selected stocks, and generating tables and graphs with your results.
Feedback
Did you use the tool? Let us know your thoughts at acsustain@acgov.org!
Acknowledgements
The tool was developed by James Dunn, Climate Corps Fellow with the Alameda County Office of Sustainability in 2017-18.